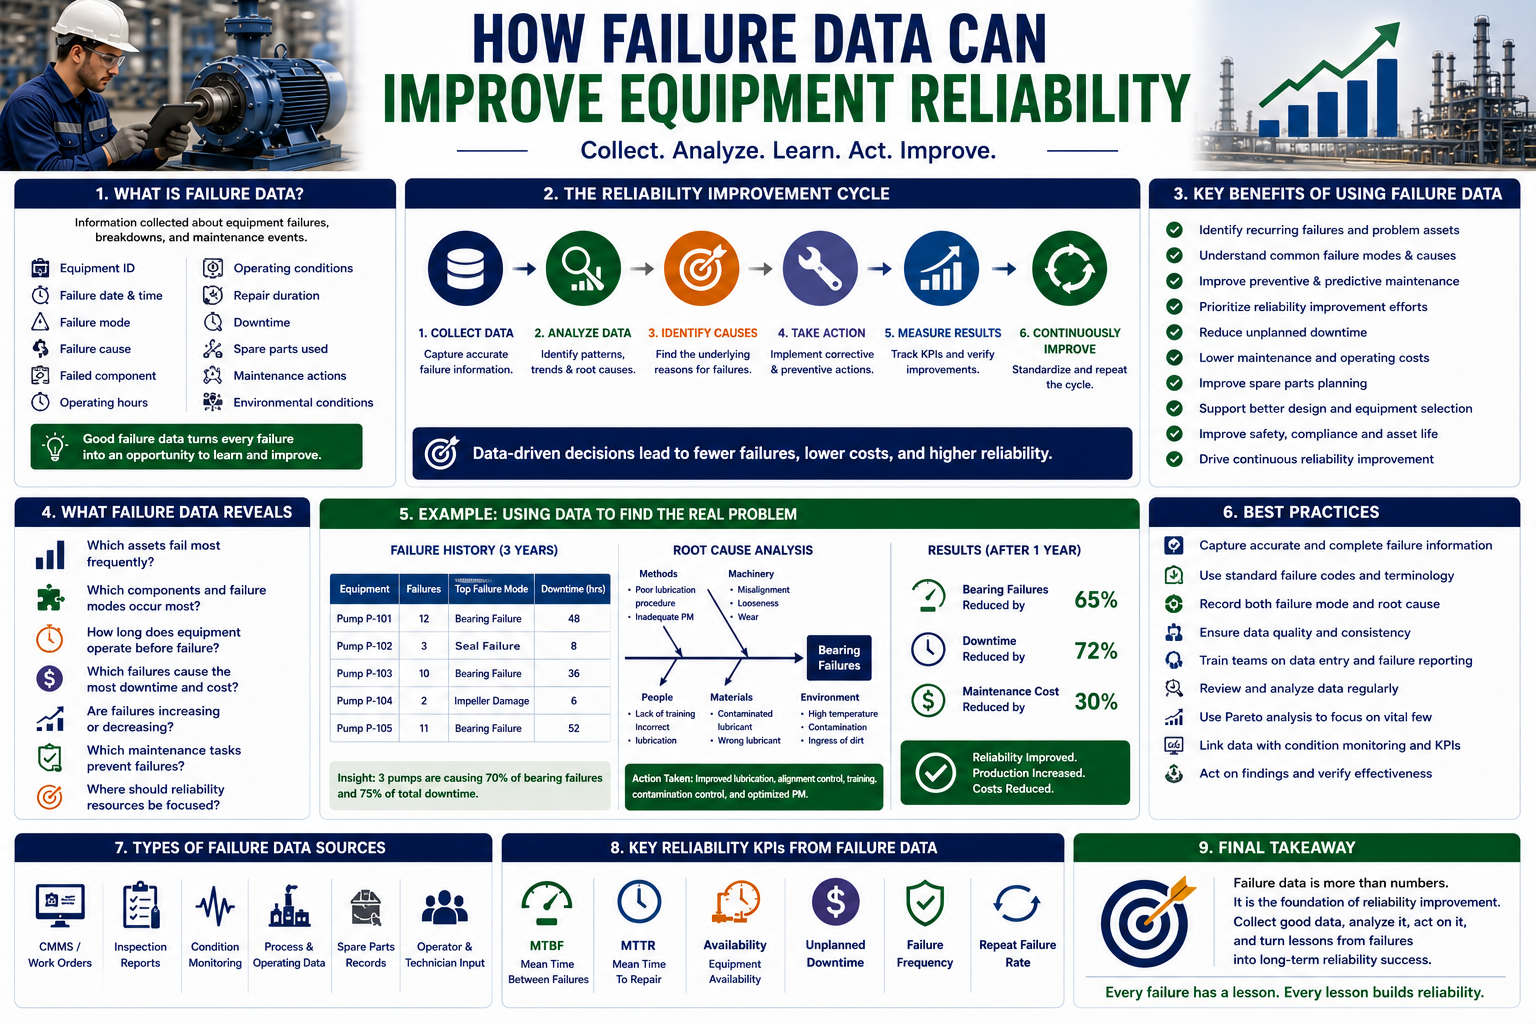
Equipment failures are a major challenge for industrial organizations. Unexpected breakdowns can stop production, increase maintenance costs, reduce equipment availability, create safety risks, and shorten asset life.
However, every equipment failure also creates an opportunity to learn.
When properly collected and analyzed, failure data can help maintenance and reliability teams understand why equipment fails, identify recurring problems, optimize maintenance strategies, and improve long-term equipment reliability.
Instead of treating each breakdown as an isolated event, organizations can use historical failure information to identify patterns and make better engineering decisions.
This article explains what failure data is, why it matters, what information maintenance teams should collect, and how organizations can use failure data to improve equipment reliability.
What Is Failure Data?
Failure data is information collected about equipment failures, breakdowns, deterioration, and maintenance events.
It can include:
- Equipment identification
- Failure date and time
- Failure mode
- Failure cause
- Failed component
- Operating hours
- Equipment condition
- Repair duration
- Downtime
- Spare parts used
- Maintenance actions
- Environmental conditions
- Operating conditions
- Inspection results
For example, instead of recording a work order simply as:
“Pump failed — bearing replaced.”
A more useful record could include:
Pump P-101 — Drive-end bearing failed after 8,200 operating hours. Excessive vibration detected two weeks before failure. Inspection identified misalignment. Shaft alignment corrected and bearing replaced.
The second record provides significantly more information for future reliability analysis.
Why Failure Data Matters
Without reliable failure information, maintenance teams often depend on experience, assumptions, and manufacturer recommendations.
These sources are useful, but historical plant data provides something especially valuable:
Evidence about how the organization’s equipment actually behaves.
Failure data can help answer questions such as:
- Which assets fail most frequently?
- Which components fail repeatedly?
- What are the most common failure modes?
- How long does equipment typically operate before failure?
- Which failures cause the most downtime?
- Are failures increasing or decreasing?
- Which maintenance tasks prevent failures?
- Where should reliability resources be focused?
This information can transform maintenance from a reactive function into a data-driven reliability process.
1. Identify Recurring Equipment Failures
One of the simplest uses of failure data is identifying equipment that repeatedly fails.
Suppose a plant has 50 pumps.
Failure records show that five pumps account for most pump-related breakdowns.
This is an important finding.
Instead of treating every pump equally, reliability engineers can focus their investigation on the five problem assets.
The team can then investigate:
- Operating conditions
- Installation quality
- Lubrication
- Alignment
- Design
- Maintenance history
- Failure modes
This approach helps direct resources toward the assets with the greatest reliability problems.
2. Identify Common Failure Modes
Failure data can reveal which components and failure modes occur most frequently.
For example, a manufacturing plant may discover that its rotating equipment experiences:
- 35% bearing failures
- 25% seal failures
- 20% coupling problems
- 10% motor problems
- 10% other failures
This information can help engineers determine where reliability improvements will have the greatest impact.
If bearing failures dominate the failure history, the organization may investigate:
- Lubrication
- Alignment
- Contamination
- Installation
- Loading
- Bearing selection
Failure-mode information is therefore essential for developing effective maintenance strategies.
3. Calculate MTBF
Mean Time Between Failures (MTBF) is a commonly used reliability metric.
A simplified formula is:
MTBF = Total Operating Time ÷ Number of Failures
For example, if a machine operates for 10,000 hours and experiences five failures:
MTBF = 10,000 ÷ 5 = 2,000 hours
Tracking MTBF over time can show whether equipment reliability is improving or deteriorating.
If MTBF increases from 2,000 hours to 3,500 hours after a reliability improvement project, the data provides evidence that the intervention may have been effective.
However, MTBF should be interpreted carefully and alongside failure-mode and operating-context information.
4. Identify the Most Expensive Failures
Not all failures have the same business impact.
A minor failure may require 30 minutes of maintenance.
Another failure may stop an entire production line for 24 hours.
Failure data can help identify failures with the greatest consequences.
Useful information includes:
- Downtime
- Lost production
- Labor cost
- Spare-parts cost
- Contractor cost
- Quality losses
- Environmental consequences
This allows organizations to prioritize reliability projects based not only on failure frequency but also on business impact.
5. Improve Preventive Maintenance
Failure data can reveal whether preventive maintenance tasks are actually effective.
Suppose a gearbox is inspected every 500 operating hours.
Historical data shows that gearbox failures continue to occur despite the inspection.
This could indicate that:
- The inspection method is ineffective
- The interval is inappropriate
- The wrong failure mode is being addressed
- The inspection is not being performed correctly
- Another root cause exists
Maintenance teams can use failure history to review and optimize the PM program.
The objective is not simply to increase maintenance frequency.
The objective is to ensure that maintenance tasks effectively control known failure modes.
6. Support Predictive Maintenance
Failure data can also support predictive maintenance programs.
Condition-monitoring information can be compared with actual failure events.
For example:
Normal vibration → Increasing vibration → Alarm → Bearing replacement → Failure avoided
By analyzing historical data, engineers can learn which changes in vibration, temperature, pressure, or other parameters tend to precede failures.
This can help establish meaningful warning thresholds and improve predictive-maintenance decisions.
7. Improve Root Cause Analysis
Failure history provides valuable information during Root Cause Analysis.
When a component fails, engineers should not look only at the current incident.
They should also ask:
“Has this happened before?”
Historical work orders may reveal that the same equipment has experienced the same failure several times.
For example:
2024 — Bearing failure
2025 — Bearing failure
2026 — Bearing failure
This pattern suggests that the organization may be treating the symptom rather than eliminating the root cause.
Historical data can therefore help identify recurring failure mechanisms.
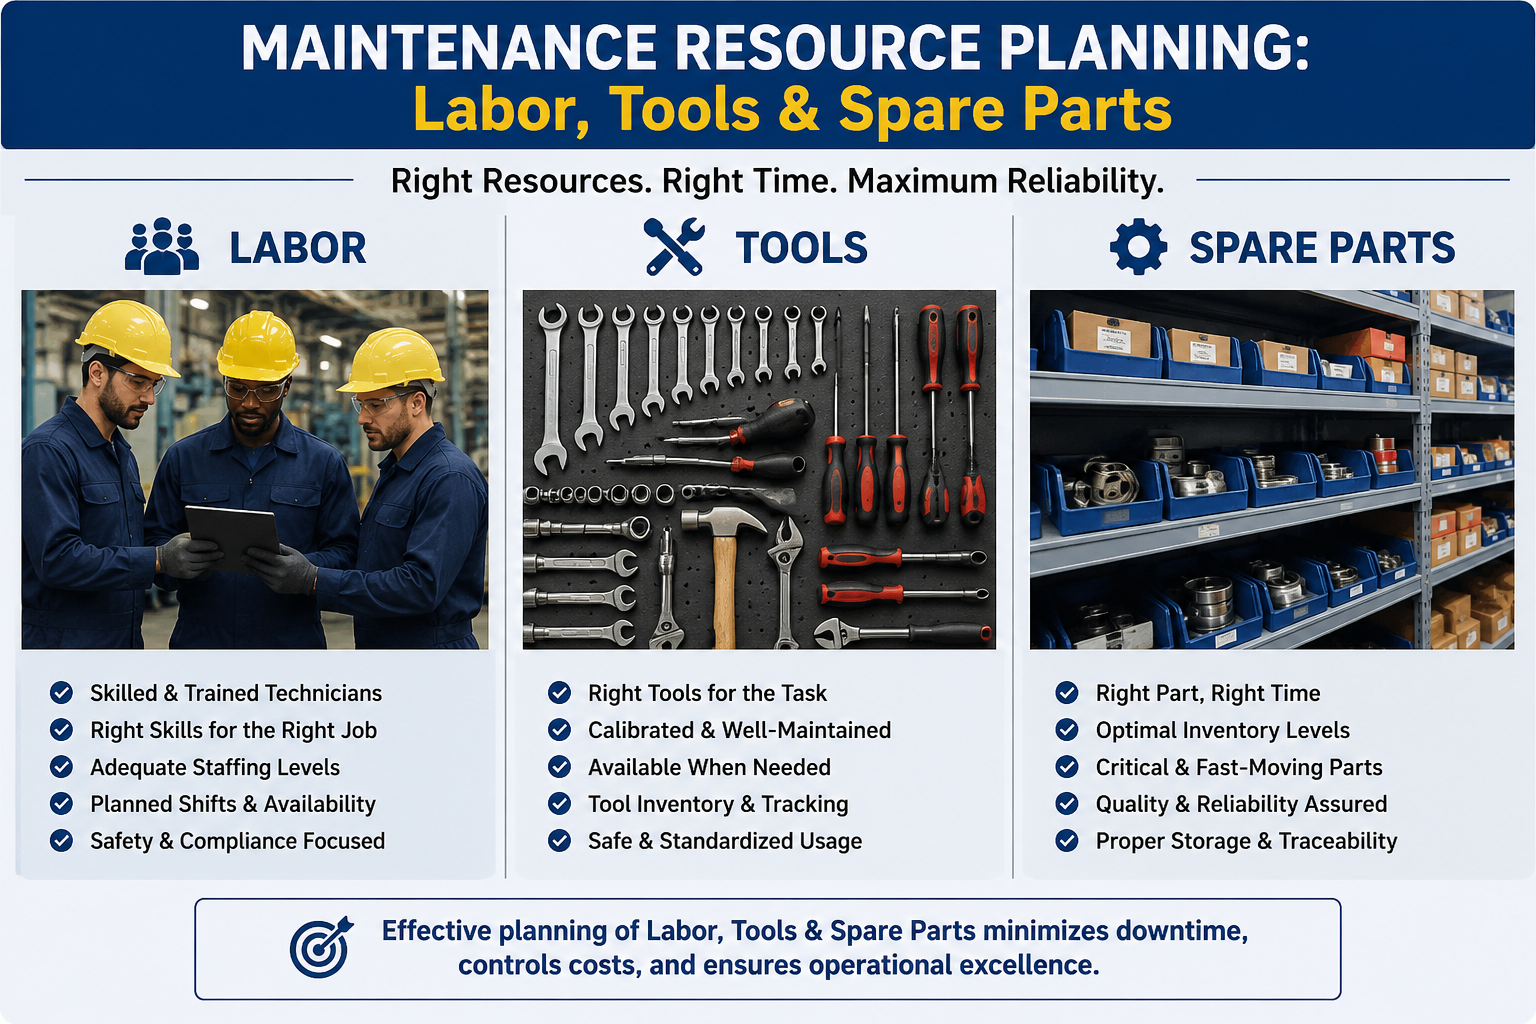
8. Support Spare-Parts Planning
Failure data can improve spare-parts management.
By analyzing historical consumption, maintenance teams can identify:
- Frequently replaced components
- Critical spare parts
- Long-lead-time items
- High-value components
- Emergency purchases
- Obsolete inventory
For example, if a specific bearing is repeatedly required for a critical machine, the organization may determine that maintaining an appropriate stock level is necessary.
At the same time, data can identify parts that have been stocked for years without being used.
This can help balance equipment availability with inventory costs.
9. Improve Equipment Selection
Failure data should not only be used after equipment is installed.
It can also influence future equipment purchases.
Suppose historical data shows that a particular type of pump has consistently experienced seal failures in a specific operating environment.
When purchasing new pumps, engineers can consider:
- Alternative designs
- Improved sealing systems
- Different materials
- Different suppliers
- Better monitoring capabilities
This creates a feedback loop:
Failure data → Engineering learning → Better equipment selection → Improved reliability
10. Support Reliability-Centered Maintenance
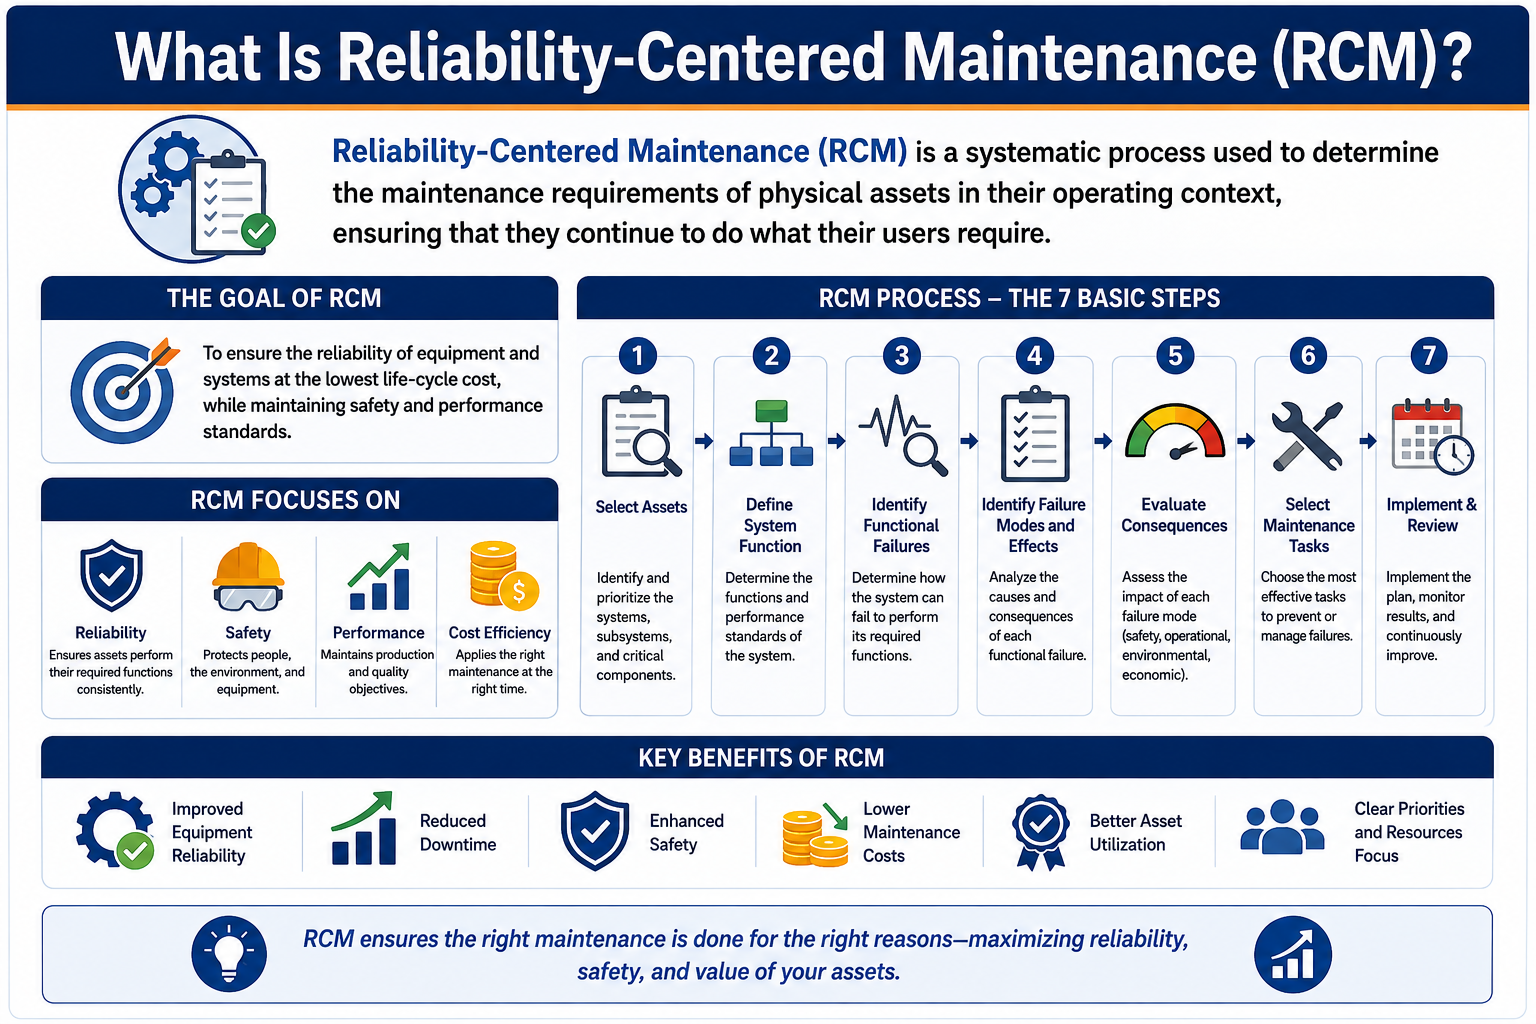
Failure data is particularly valuable when developing or reviewing a Reliability-Centered Maintenance (RCM) program.
RCM asks important questions about:
- Equipment functions
- Functional failures
- Failure modes
- Failure effects
- Failure consequences
- Appropriate maintenance tasks
Actual failure history can help validate assumptions made during an RCM analysis.
Instead of relying entirely on generic information, engineers can incorporate real plant experience into maintenance decisions.
11. Use Pareto Analysis
Pareto analysis can help maintenance teams identify the small number of problems responsible for a large proportion of failures or downtime.
For example, a plant may discover that:
- 10% of assets create 60% of downtime
- Three failure modes create 50% of failures
- Two equipment types account for most maintenance costs
This information allows engineers to focus on the vital few problems rather than attempting to improve everything simultaneously.
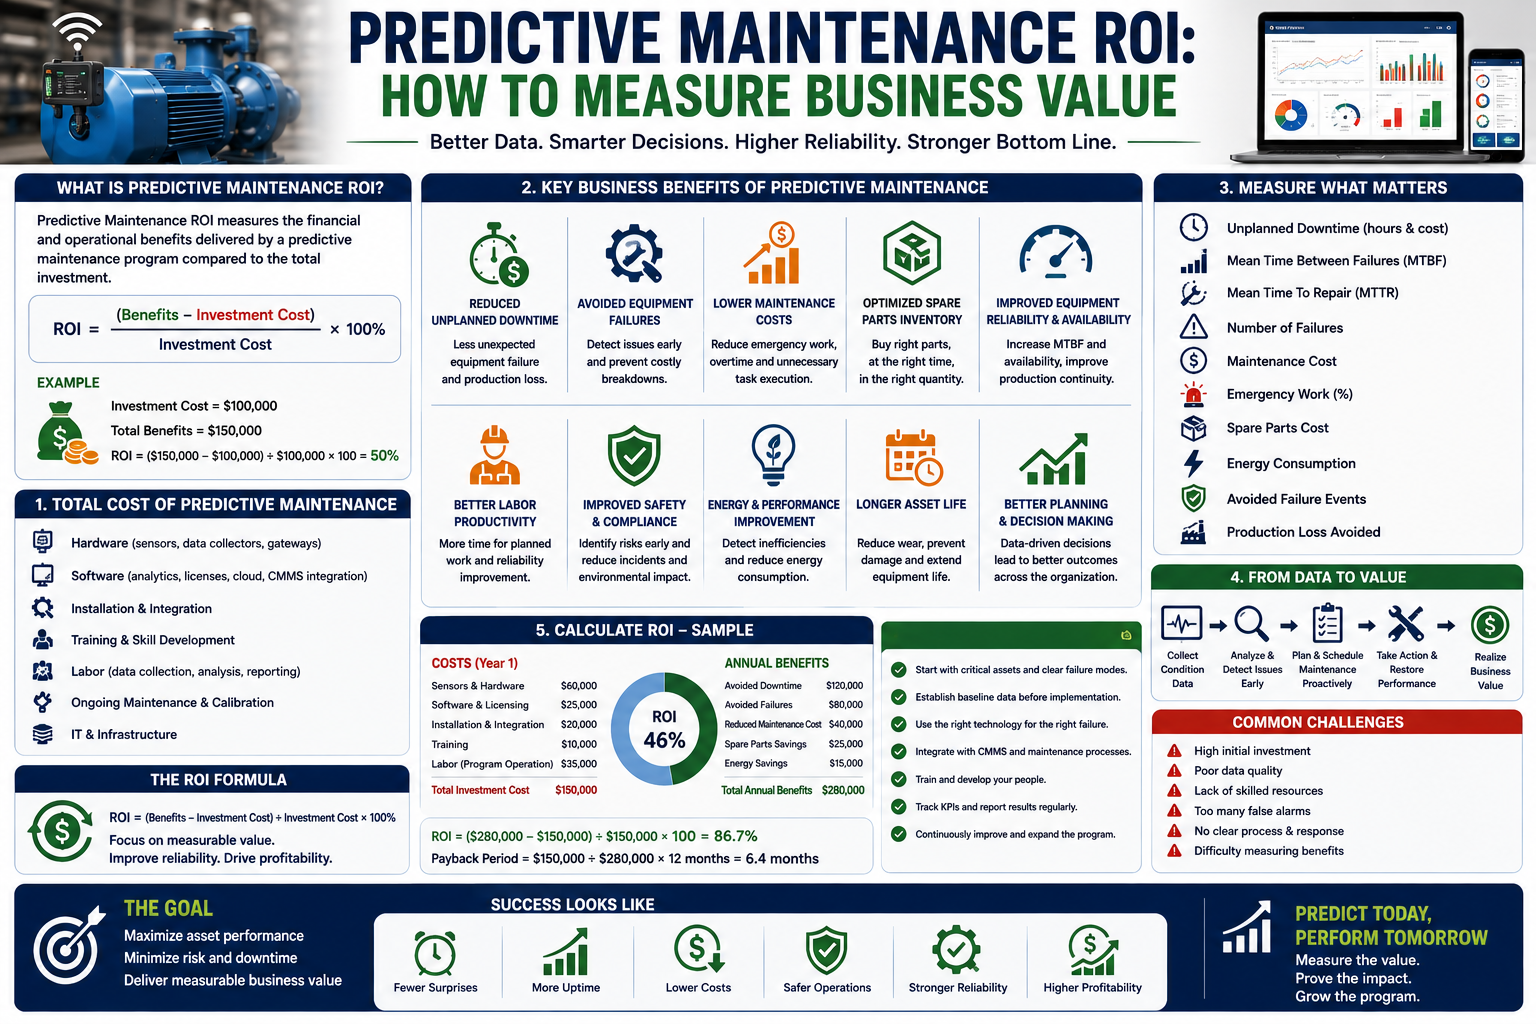
12. Improve Maintenance KPIs
Failure data supports several important maintenance KPIs.
These may include:
MTBF
Shows average operating time between failures.
MTTR
Shows average time required to restore equipment.
Availability
Shows the proportion of required time equipment is available.
Failure Frequency
Shows how often specific failure modes occur.
Unplanned Downtime
Measures unexpected equipment downtime.
Repeat Failure Rate
Identifies equipment or components that repeatedly experience similar failures.
Tracking these metrics over time can help management determine whether reliability initiatives are delivering results.
13. Improve Data Quality
Failure analysis is only as good as the data being analyzed.
Maintenance teams should establish consistent failure-reporting standards.
Work orders should ideally capture:
- Asset number
- Failure date
- Failure mode
- Failed component
- Failure cause
- Corrective action
- Downtime
- Operating conditions
- Repair time
Using standardized failure codes can make analysis easier.
For example, instead of having technicians enter different descriptions such as:
“Bearing bad”
“Bearing damaged”
“Bearing worn”
the organization can establish standardized categories for bearing failure modes and causes.
14. Combine Failure Data With Other Information
Failure data becomes more powerful when combined with other sources.
These may include:
- Condition-monitoring data
- Production data
- Operating parameters
- Inspection results
- Environmental data
- Maintenance costs
- Spare-parts records
- Operator observations
For example, an engineer may discover that pump failures increase when production rates exceed a certain operating range.
That relationship might not be visible from maintenance records alone.
Combining multiple data sources can provide a more complete picture of asset performance.
15. Use Failure Data for Continuous Improvement
Failure data should not be collected simply to create reports.
The real value comes from turning information into action.
A continuous improvement cycle can be:
Collect Data → Analyze Failures → Identify Patterns → Investigate Causes → Implement Improvements → Measure Results → Repeat
This creates a learning system where every significant failure can contribute to better future performance.
Common Problems With Failure Data
Organizations often face challenges such as:
- Incomplete records
- Incorrect failure codes
- Missing downtime information
- Inconsistent terminology
- Poor work-order descriptions
- Failure causes confused with failure modes
- Lack of technician training
- Data stored in disconnected systems
These problems can reduce the value of reliability analysis.
Training maintenance personnel and establishing clear data standards are therefore essential.
Practical Example
Imagine a factory has 20 production motors.
Over three years, the maintenance database records 60 motor failures.
Analysis shows that:
- 30 failures involve bearings
- 15 involve electrical problems
- 10 involve cooling problems
- 5 involve other causes
Further investigation shows that most bearing failures occur on motors exposed to high levels of contamination.
The organization introduces:
- Improved sealing
- Better housekeeping
- Improved lubrication practices
- More frequent condition monitoring
After implementation, bearing failures decline significantly.
This example demonstrates how failure data can move an organization from:
“Replace failed bearings.”
to:
“Identify why bearings are failing and eliminate the underlying conditions.”
Best Practices for Using Failure Data
Organizations can improve the value of failure data by following several principles:
- Standardize failure terminology.
- Record failure modes and causes separately.
- Capture accurate downtime information.
- Train technicians on data entry.
- Review recurring failures regularly.
- Use Pareto analysis to prioritize problems.
- Combine failure data with condition-monitoring information.
- Perform RCA on significant failures.
- Track the effectiveness of corrective actions.
- Use historical data when developing maintenance strategies.